Standard Deviation
The standard deviation of returns is a measure of the risk of a single asset.
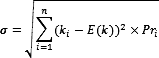
Where
ki = the return in state i
E(k) = the expected return
Pri = the probability of state i
To investigate standard deviation using the graph, move the purple markers representing the returns in each of four states of nature, and examine the effect on expected return, deviations (purple line segments), and standard deviation (the orange bar on the y-axis).
Assume that the four states of nature are equally probable.